Published On Premiered Apr 23, 2024
🔥Post Graduate Program In Data Analytics: https://www.simplilearn.com/pgp-data-...
🔥IIT Kanpur Professional Certificate Course In Data Analytics (India Only): https://www.simplilearn.com/iitk-prof...
🔥Caltech Data Analytics Bootcamp(US Only): https://www.simplilearn.com/data-anal...
🔥Data Analyst Masters Program (Discount Code - YTBE15): https://www.simplilearn.com/data-anal...
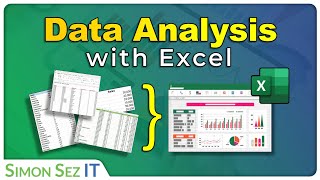
Hidden Chart Function In Excel by simplilearn is about the REPT Function In Excel. This REPT Function in excel tutorial will help you to learn How To Create A Bar Graph using the simple REPT function. Dive into our latest Excel tutorial where we unleash the power of the REPT function to create visually impressive bar graphs! Whether you're a beginner or an Excel enthusiast, this video is designed to enhance your data presentation skills.
In this video, you'll learn:
What the REPT function is and how it can be used creatively in Excel.
Step-by-step instructions on how to convert plain data into engaging bar graphs without using typical chart tools.
Tips and tricks to customize your graphs for maximum impact.
✅ Subscribe to our Channel to learn more about the top Technologies: https://bit.ly/2VT4WtH
#excel #exceltutorial #msexcel #2024 #Simplilearn
➡️ About Post Graduate Program In Data Analytics
This Data Analytics Program is ideal for all working professionals and prior programming knowledge is not required. It covers topics like data analysis, data visualization, regression techniques, and supervised learning in-depth via our applied learning model with live sessions by leading practitioners and industry projects.
✅ Key Features
- Post Graduate Program certificate and Alumni Association membership
- Exclusive hackathons and Ask me Anything sessions by IBM
- 8X higher live interaction in live online classes by industry experts
- Capstone from 3 domains and 14+ Data Analytics Projects with Industry datasets from Google PlayStore, Lyft, World Bank etc.
- Master Classes delivered by Purdue faculty and IBM experts
- Simplilearn's JobAssist helps you get noticed by top hiring companies
- Resume preparation and LinkedIn profile building
- 1:1 mock interview
- Career accelerator webinars
✅ Skills Covered
- Data Analytics
- Statistical Analysis using Excel
- Data Analysis Python and R
- Data Visualization Tableau and Power BI
- Linear and logistic regression modules
- Clustering using kmeans
- Supervised Learning
👉 Learn More At: https://www.simplilearn.com/post-grad...
🔥🔥 Interested in Attending Live Classes? Call Us: IN - 18002127688 / US - +18445327688
👉 Listen to what millions of users say about our courses! https://www.simplilearn.com/reviews?u...