Published On Jun 21, 2020
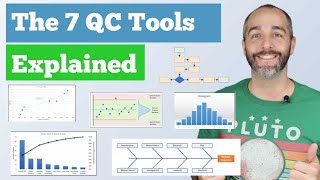
Hello guy's, Today in the world of cutting edge technology Quality is very important but to maintain the quality some times problem arises. So today I will explain you about the 7 QC tools.
Subscribe Here:- / @meetmaverick7149
The 7 QC tools are also known as "The Old Seven QC Tool." "The First Seven QC Tool." "The Basic Seven QC Tool."
7 Qc tools introduced in Japan when the country was undergoing major quality revolution & mandatory for all industrial training by Karou Ishikawa. . As per Karou Ishikawa 95% of the problems are solved by these tools.
Why Use 7 QC Tools?
QC tool is Simple Visual & Statistical tool use for problem solving.
These tools used to analyze process, identify the major issues, control the variation in quality, guide to prevent from producing defects in future.
These tool can be use by any person having very basic training to solve the problem in there quality. This Does not required complicated graphical & Statical Competence.
It also facilitates the organization to solve basic problems in there Process.
So First Tool is Cause and effect diagram. It is a Graphical tool used to identify the possible causes of the particular problem in different category. This Tool Introduced by Karou Ishikawa so this diagram also called as Ishikawa Diagram or Fishikawa
Cause and effect diagrams also known as fishbone diagrams, her-ring-bone diagrams.
This Diagram is looks like fish skeleton.
This Diagram is uses to search out and organize all possible factors for a problem.
Pareto chart is a tool to select vital few & Few trivial many. Its a statistical tool & It contains both Bars & Line Graphs where individual values are represented in descending order by bars, and the cumulative total is represented by the line. The Purpose of the Pareto chart is to highlight the most important among a set factors. This helps to study and analyze the occurrences of an event in a process and identify the biggest factor. This diagrams communicate the principle of 80:20. It states that 80% of an effect comes from 20% of the causes.
This tool is used for statistical visual representation. Stratification analysis is a quality assurance tool used to sort data, objects, and people into separate and distinct groups that helps in deriving meaningful information to understand an existing problem.
Check sheet used for qualitative & Quantitative data. It collects the real time data from the location where it is generated. When the check set are quantitative the it is called as tally sheet.
It is also used
To check the shape of the probability distribution of a process
To quantify defects by type
To quantify defects by location
To quantify defects by cause
The histogram can help you represent frequency distribution of data clearly and concisely among different groups of a samples
histogram also used to understand the factors or data that repeat more often
Scatter Diagram
This Diagram is used to represent the relation between 2 variables. 1 Variable is on X axis & Other one is on Y axis.
The relationship can be linear, curvilinear, exponential, logarithmic, quadratic, polynomial etc.
Control chart is also called as Shewhart Chart named after Walter A. Shewhart
Control Chart is used to study how the process is changed with period of the time.
It is best forecast tool as compared to other qc tool.
When used for process monitoring, it helps the user to determine the appropriate type of action to take on the process depending on a degree of variation in the process
So This is all about the 7 QC tools. If you likes my video then please hit like button and subscribe my channel.
#7QCTOOLS #ProblemSolving #QualityControl #QualityCircle
AIAG-VDA FMEA
https://amzn.to/2ZRn22z
AIAG PPAP
https://amzn.to/2AsscY5
MI TV 43 Inch
https://amzn.to/3hbnn6m
MI TV 4X (50 Inch)
https://amzn.to/2YevFC6