
Published On Mar 3, 2024
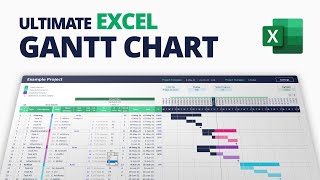
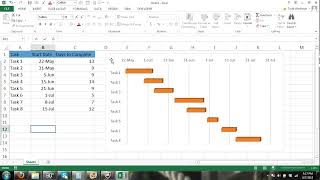
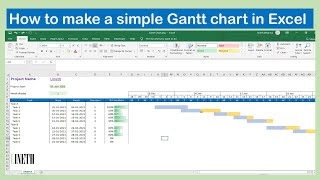
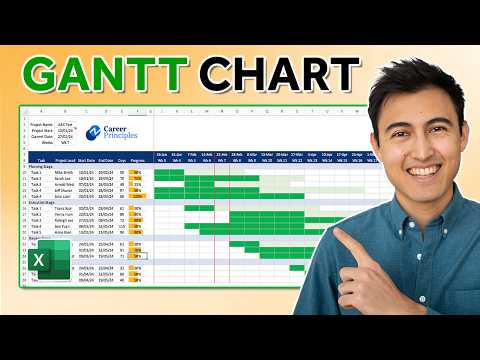
Make Gantt Chart in Excel for Project Management.
🚀 Take our Excel course here: https://www.careerprinciples.com/cour...
In this video we'll create this awesome Gantt Chart in Excel in 4 simple steps. It's fully dynamic, so you can change the project start date and the whole chart timeline changes, you can track the progress of your tasks on a percentage basis, and even add new activities as you see fit.
As we start from scratch, first we'll add all the values and format the chart. Second, we'll create a dynamic date timeline in weeks. Third, we'll create conditional formatting formulas to make the Gantt Chart dynamic. Finally, we'll freeze panes and add more conditional formatting to track the current week.
LEARN:
🔥Power BI for Business Analytics: https://www.careerprinciples.com/cour...
📈 The Complete Finance & Valuation Course: https://www.careerprinciples.com/cour...
👉 Excel for Business & Finance Course: https://www.careerprinciples.com/cour...
🚀 All our courses: https://www.careerprinciples.com/courses
SOCIALS:
📸 Instagram - https://www.instagram.com/careerprinc...
🤳 TikTok - / career_principles
🧑💻 LinkedIn - / careerprinciples
▬▬▬▬▬▬▬▬▬▬▬▬▬▬▬▬▬▬▬▬▬▬▬▬▬▬▬▬▬▬▬▬▬▬▬▬▬▬▬▬
Chapters:
0:00 - Intro
0:30 - 1. Chart Formatting
4:17 - 2. Dynamic Date Values
7:27 - 3. Dynamic Fill Values
15:18 - 4. Final Edits (view & date tracker)