Published On Jan 9, 2023
Subscribe to this Channel for all support.
In this video you will learn the following:
1) What is What-if Analysis in Excel?
2) How to use What-if Analysis in Excel?
3) What is 1 way dimension analysis in Excel?
4) What is 2 way Dimension analysis in Microsoft Excel?
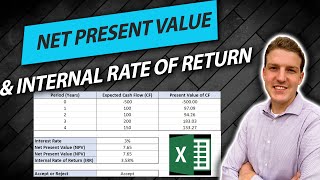
5) How to do profit calculation in Excel?
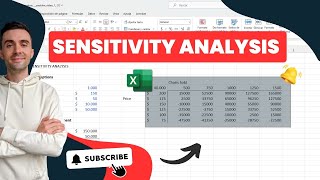
6) What is Data Table What-If Analysis
This Video is essential to watch for every person including students, officers and business person.
To get this file.
1. Subscribe to this channel
2. our Facebook Page
/ exceldoers
visit https://www.exceldoers.com/newsletter/
and email your request at [email protected]
or send request through contact form at www.exceldoers.com
Only people with subscribe this channel and facebook will be able to request this file.. so make sure you subscribe to this channel
#excelanalysis #dataanalysis #sensitivity #whatifanalysis #excel #analysis #What-if #datatable
What-if Analysis in Excel
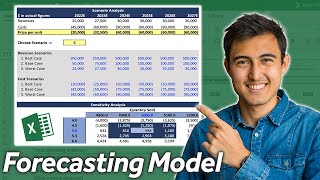
Scenario Manager in Excel
Goal Seek in Excel
Data Table in Excel
Data Analysis in Excel
Profit Optimization in Excel
Optimization in Excel
How to use Goal Seek in Excel
Goal Seek with Example in Excel
Scenario Manager with Example in Excel
Data Table with example in Excel
What if Analysis tutorial in Excel
A "What-If Analysis" in Excel is a powerful tool that allows you to analyze the potential outcomes of different scenarios. In this video, we will be demonstrating how to use the "What-If Analysis" feature in Excel to make better-informed decisions.
First, we will go over the different types of "What-If Analysis" available in Excel, such as Goal Seek and Scenario Manager. We will then show you how to set up a scenario and how to use Goal Seek to find the input value that will give you a desired result.
Next, we will demonstrate how to use Scenario Manager to create, manage, and compare multiple scenarios. We will show you how to create a summary report that shows the results of all the scenarios in one place.
Finally, we will be discussing how to use the Data Tables feature, which allows you to see the results of a formula for different input values. We will be showing you how to create one-variable and two-variable data tables, which are useful for analyzing different scenarios.
Overall, this video will be a comprehensive guide on how to use Excel's "What-If Analysis" features to make better-informed decisions. By the end of the video, you will have a better understanding of how to use Goal Seek, Scenario Manager, and Data Tables, and you will be able to apply them to your own data in Excel.