Published On Aug 30, 2020
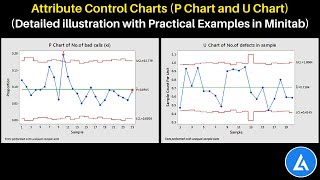
Attribute charts are part of probability based charts. These charts uses attribute data line YES-NO, PASS-FAIL, OK-NG etc. These control charts uses categorical data and the probabilities related to the categories to identify the presence of special cause. The analysis of oratorical data by these charts general utilize the binomial or Poisson distribution.
There are four types of attribute charts: c chart, n chart, np chart, and u chart. The choice of charts depends on whether you have a problem with defects or defectives, and whether you have a fixed or varying sample size.
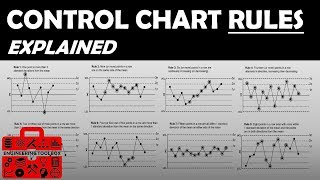
Now lets move to find the 8 differences between various attribute control charts & how various charts are different from each other.
#AttributeChart #ControlChart #SPC