Published On Sep 15, 2014
Check out our brand-new Excel Statistics Text: https://www.amazon.com/dp/B076FNTZCV
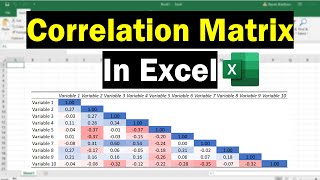
How to Calculate the Correlation using the Data Analysis Toolpak in Microsoft Excel is Covered in this Video (Part 1 of 2).
Correlation in Excel
Data Analysis Toolpak
Pearson's r in Excel
Statistics in Excel
Video Transcript:
In this video we'll take a look at how to calculate the correlation coefficient in Microsoft Excel. Now on your screen here we have two variables hours studied and that indicates the number of hours studied for an exam and then exam grade which is just a percentage grade on an exam. Now we want to calculate the correlation between these two variables to see if there's a relationship there. So do that we want to go to Data and then select Data Analysis and here we want to select Correlation and then click OK and then for Input Range what we want to do here is select all of our values and I'm going to go ahead and select the variable names as well. So click the mouse and hold the mouse button down and select all the cells there and I want to be sure since I did select the variable names or labels that I check the Labels in First Row box then click OK and then here I'm going to go ahead and expand this a little bit because it's quite small and then we'll go and round this down as well. OK so that's our correlation. I can also put it right here it's the same thing so let's take a look at what this is here. So the correlation between exam grade and our study is .86 so we could say r for Pearson's r equals .86. Now that indicates a very strong positive correlation between number of hours studied and the grade on the exam. So in other words the way we would interpret a positive correlation is people who studied more hours tended to do better on the exam and people who studied fewer hours tended to do worse on the exam. Now the relationship isn't perfect but it is very strong in this example. Now in our next video we'll test this value .86 to see whether it's significantly different from zero.
YouTube Channel: / statisticsinstructor
Channel Description: For step by step help with statistics, with a focus on SPSS (with Excel videos now too). Both descriptive and inferential statistics covered. For descriptive statistics, topics covered include: mean, median, and mode in spss, standard deviation and variance in spss, bar charts in spss, histograms in spss, bivariate scatterplots in spss, stem and leaf plots in spss, frequency distribution tables in spss, creating labels in spss, sorting variables in spss, inserting variables in spss, inserting rows in spss, and modifying default options in spss. For inferential statistics, topics covered include: t tests in spss, anova in spss, correlation in spss, regression in spss, chi square in spss, and MANOVA in spss. New videos regularly posted. Videos series coming soon include: multiple regression in spss, factor analysis in spss, nonparametric tests in spss, multiple comparisons in spss, linear contrasts in spss, and many more. Subscribe today!
YouTube Channel: / statisticsinstructor