Published On May 7, 2024
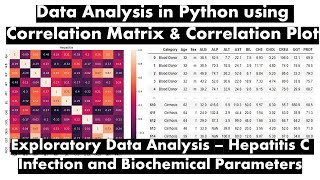
Create a correlogram as a graphic representation of the correlations between multiple variables. Used in exploratory data analysis to understand the data.
Python workbook available here: https://drstephpowers.github.io/BIA/
show more