Published On Jan 25, 2018
Join 400,000+ professionals in our courses here 👉 https://link.xelplus.com/yt-d-all-cou...
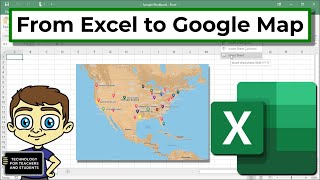
Learn how to create dynamic, interactive map charts in Excel, showcasing key performance indicators (KPIs) by geography. Ideal for visualizing company, division, or product performance across different regions.
⬇️ Download the workbook here: https://pages.xelplus.com/dynamic-map...
✨ Key Highlights:
▪️ Interactive Map Creation: Step-by-step guide to building a dynamic map that lets you switch views between divisions and see the revenue for each region.
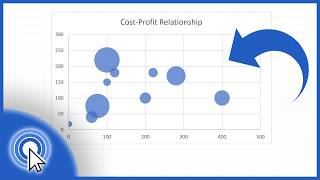
▪️ Techniques & Tools: Discover how to use scatterplots with background images, transition to bubble charts, and add extra dimensions to your charts.
▪️ Data Visualization: Enhance your maps with interactivity, allowing users to select divisions and visualize revenue changes.
▪️ Practical Example: Watch us create a sample map chart, showing revenue data for different regions and divisions.
▪️ Advanced Tips: Learn conditional formatting in charts to highlight key data points, like the region with maximum sales.
00:00 How to Create Interactive Map Charts in Excel
03:03 Adding Map Picture
06:12 Data Preparation
07:40 Setting Up the Chart
09:29 Adding Interactivity to the Chart
12:08 Updating the Bubble Chart
15:03 Conditionally Format Data Points
The technique shown uses a scatter plot first to set up the respective points on the map and then turns it into a bubble chart to be able to visualize the actual KPI.
I also show you how you can conditionally format specific data points to bring the attention to certain categories. In this case I conditionally format the largest data point in the chart in a different color than the rest. This technique is really simple but has a very powerful effect. It makes the difference between a "nice" Excel dashboard to a "great" Excel dashboard. All it takes is 3 minutes of your time.
Links to related videos:
SumIFS formula: • How to Use SUMIFS, COUNTIFS and AVERA...
➡️ Join this channel to get access to perks: / @leilagharani
👕☕ Get the Official XelPlus MERCH: https://xelplus.creator-spring.com/
🎓 Not sure which of my Excel courses fits best for you? Take the quiz: https://www.xelplus.com/course-quiz/
🎥 RESOURCES I recommend: https://www.xelplus.com/resources/
🚩Let’s connect on social:
Instagram: / lgharani
LinkedIn: / xelplus
Note: This description contains affiliate links, which means at no additional cost to you, we will receive a small commission if you make a purchase using the links. This helps support the channel and allows us to continue to make videos like this. Thank you for your support!
#excel