Published On Jan 29, 2019
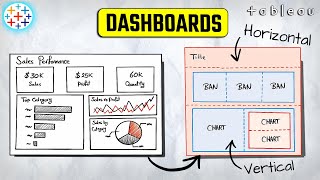
Learn to use Tableau to produce high quality, interactive data visualizations!
Tableau can help you see and understand your data. Connect to almost any database, drag and drop to create visualizations, and share with a click.
🔗Tableau Public: https://public.tableau.com/en-us/s/
🔗Kaggle dataset: https://www.kaggle.com/c/titanic/data
Find more data science information: https://www.velocityanalytics.io/
Tutorial from Velocity Consulting. Check out their YouTube channel: / @brandon-young
--
Learn to code for free and get a developer job: https://www.freecodecamp.org
Read hundreds of articles on programming: https://medium.freecodecamp.org
show more