Published On Jul 16, 2020
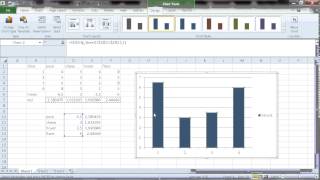
How To Find Mean,Median, Mode, Standard Deviation And Statistical Chart In Excel.My Channel All About MATHEMATICS And Its Applications Some More
How to crate Barcode in Excel. Easy & Simplest Method:- • How to crate Barcode in Excel. Easy &...
How To Find Mean,Median, Mode and Standard Deviation In Excel || Also Showing Statistical Chart :- • How To Find Mean,Median, Mode and Sta...
Applications Of Statistics In Our Daily Life And Different Types Of Statistical Charts:- • Applications Of Statistics In Our Dai...
HOW to Create a Statistical Chart In Excel || Covid 19 Report:- • HOW to Create a Statistical Chart ...
How To Create a Students Marklist In Excel Sheet || Total Mark,Average,Result and Statistical Chart:- • How To Create a Students Marklist In ...
How To Make MATHS Power Point Presentation Slideshow:- • How To Make MATHS Power Point Prese...
Basic Example For Scatter Chart In Excel || x,y -axis / data series / scatter plot.:- • Basic Example For Scatter Chart In ...
Basic Excel Malayalam Tutorial Part -1 |:- • Basic Excel Malayalam Tutorial Part -...
How To Create COVID-19 Report In Scatter Chart||Example for Scatter Graph 3 variables:- • How To Create COVID-19 Report In Scat...