Published On Feb 2, 2018
here I explain how to understand and shade venn diagrams.
Thank you to those who keep funding me via
/ kisemboacademy for supporting the production of these videos.
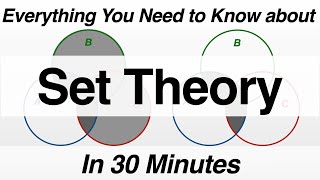
A Venn diagram is an illustration of the relationships between and among sets, groups of objects that share something in common. Usually, Venn diagrams are used to depict set intersections (denoted by an upside-down letter U).
Venn diagrams enable students to organise information visually so they are able to see the relationships between two or three sets of items. They can then identify similarities and differences. A Venn diagram consists of overlapping circles. Each circle contains all the elements of a set.
this video seeks to explain how we shade sets in venn diagrams.
#Physicsmaths
#Physicsmaths