Published On Sep 5, 2019
Join 400,000+ professionals in our courses here 👉 https://link.xelplus.com/yt-d-all-cou...
Learn how to create a stunning doughnut chart in Excel with this easy-to-follow video. Whether you're an Excel beginner or a seasoned user, you'll find valuable tips to enhance your charts.
⬇️ DOWNLOAD the workbook here: https://pages.xelplus.com/progress-ci...
Two Unique Methods: Discover not one, but two methods to create doughnut charts with smooth, rounded edges. Both methods are explained in detail, ensuring you can follow along regardless of your Excel experience.
Step-by-Step Guide: The video walks you through the entire process, from setting up your data to fine-tuning the visual details of your chart.
You'll learn how to:
▪️ Input and prepare data for the chart
▪️ Insert and adjust a doughnut chart
▪️ Customize with colors and titles
▪️ Embed additional information within your chart
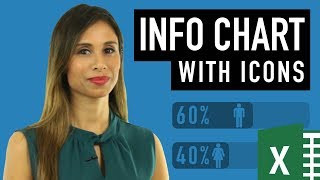
This Progress circle chart infographic is different to what you've seen before.
Just like the other progress circle charts it uses the doughnut chart as the basis. A text box is placed in the middle of the progress chart (I will show you an Excel chart trick to embed the text box inside the chart object). The value of the text box is connected to the percentage completed value which is input in a cell.
00:00 How to Create a Professional Doughnut Chart in Excel
00:42 Progress Circle Chart Version Leila
04:57 Progress Circle Chart Version Sam
10:00 Wrap Up
What makes this chart different to the rest?
It's a small design tweak that makes THIS progress circle chart look more professional. This chart comes with ROUNDED EDGES. This seems like a small tweak, but there isn't a simple option in Excel to get the inside shape have rounded edges. In this video you'll find two versions to create this Excel progress chart infographic with rounded edges (or the doughnut chart with rounded edges):
Version #1 (by me) - It requires a simple tweak to the border of the chart. This brings us halfway there but it doesn't give the professional look we're going after.
Version #2 (by Sam Dekoven): This version has perfectly rounded edges for the doughnut chart and it uses a smart technique which combines a scatter plot series with the doughnut chart (together with the SIN COS and PI Excel Functions). Many thanks to Sam for sharing his version with all of us!
LINKS to Excel infographic chart playlist: • Excel Infographic Chart Templates
Advanced Chart Techniques: • Excel Charts
➡️ Join this channel to get access to perks: / @leilagharani
👕☕ Get the Official XelPlus MERCH: https://xelplus.creator-spring.com/
🎓 Not sure which of my Excel courses fits best for you? Take the quiz: https://www.xelplus.com/course-quiz/
🎥 RESOURCES I recommend: https://www.xelplus.com/resources/
🚩Let’s connect on social:
Instagram: / lgharani
LinkedIn: / xelplus
Note: This description contains affiliate links, which means at no additional cost to you, we will receive a small commission if you make a purchase using the links. This helps support the channel and allows us to continue to make videos like this. Thank you for your support!
#Excel