Published On Aug 10, 2020
What is u Chart?
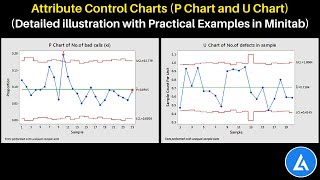
A u-chart is an attributes control chart used with data collected in subgroups of varying sizes. U-charts show how the process, measured by the number of nonconformities per item or group of items, changes over the time. Nonconformities are defects or occurrences found in the sampled subgroup.
In statistical quality control, the u-chart is a type of control chart used to monitor "count"-type data where the sample size is greater than one, typically the average number of nonconformities per unit.
the plotted value is a fraction or percent of the sample subgroup size, the size of the sample group can vary without rendering the chart useless. In this case, the control chart high and low limits vary from sample interval to sample interval, depending on the number of samples in the associated sample subgroup
Difference between u chart and other attribute chart.
Now U Chart Vs P & np Chart
this chart tracks the number of defects, not the number of defective parts as done in the p-chart, and np-chart
Now the u chart vs Chart
The C chart is used when a single unit will be examined for nonconformities at each time point.
The U chart is used when a number of units will be sampled at each time point, and a per unit average number
of nonconformities will be obtained.
#AttributeChart #uChart #ControlChart