Published On Sep 14, 2021
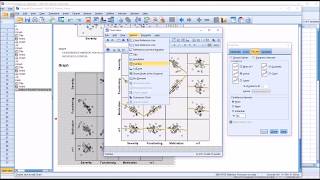
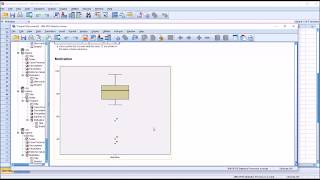
In this video, I demonstrated how to identify Outliers in dataset using Scatter plots in SPSS. In my previous videos, I had used different approaches to identify Outliers in dataset, including:
1. Tukey's Hinges approach,
2. Stem-and-leaf Plot approach and
3. Boxplots approach respectively
It is important you see those videos to also learn other ways of identifying Outliers in your data. Please, use the links below:
Identify Outliers using Tukey's Hinges Approach in SPSS: • Identify Outliers using Tukey's Hinge...
Identifying Outliers in Dataset using Stem-and-leaf Plot and Boxplots in SPSS: • Identify Outliers using Stem-and-leaf... .
My other previous videos include:
Introduction to SPSS Software for Beginners (Part-1): • Introduction to SPSS Software for Beg...
Introduction to SPSS Software for Beginners (Part-2): • Introduction to SPSS Software for Beg...
Test of Normality of Data in SPSS: • Test of Normality of Data in SPSS
Analysis of Variance in SPSS (Effect size and Interpretations): • Analysis of Variance in SPSS (Effect ...
Paired Sample T-Test in SPSS and Interpretations: • Paired Sample T Test in SPSS and Inte...
How to Perform and Interpret One Sample T-Test in SPSS: • One Sample T-Test in SPSS and Interpr...
How to Perform Descriptive Statistics in SPSS: • Descriptive Statistics in SPSS
If you like this video and you want to see more video contents like this, please give this video a thumbs up, and please Subscribe to my YouTube Channel, so that we begin to send you Notifications every time I publish new and useful contents. SUBSCRIPTION IS FREE.