Published On Feb 21, 2024
Title, essentially.
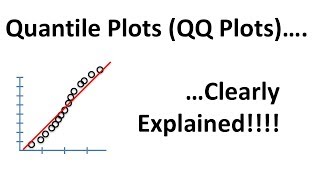
Properly interpreting normal QQ plots takes some experience, and part of that experience is developing a feel for what natural variability looks like on a normal QQ plot (when sampling from a normal distribution).
Each of these 1000 plots is based on a sample of size 25 from a normal distribution with a mean of 10 and standard deviation of 5. Created with R’s qqnorm and qqline.
Which one is your favourite? Mine are 225, 245, 314, and 330. I’m (kinda) joking. Or not.
Looking for more info about normal QQ plots? I have a full video description of them here:
• Normal Quantile-Quantile Plots
I’ll try to get back to making real videos, folks. But I think this one is useful and I have places I'd like to use it.
show more