Published On Oct 16, 2023
1) Cleaning up the table 0:04
2) Rounding data to proper decimal places 2:37
3) Calculating Mean & SD 3:36
4) Making the scatterplot graph 6:52
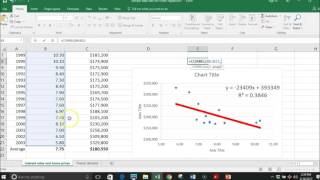
5) Adding details to the graph 10:23
6) Calculating r-squared 10:35
7) Copying and pasting into the assignment 13:59
NOTE: For part #5 "adding details to the graph," the computer did not record the short segment where I show how to make the trendline and add axis labels. Rather than record a whole new video, I will give a brief explanation here as it really is simple.
First, you must have a graph made and ready to go, along with the graph settings "chart editor" open (you can double-click on the graph to open this).
To make the trendline, look at the "chart editor" and select "customize" at the top. From the list of options, select "series," then scroll down until you see "trendline" and select.
To create axis titles for the X and Y axis, go back to the "customize" menu under "chart editor" and select "chart & axis titles". Click on the drop-down tab that shows "chart title" and select either "horizontal" or "vertical axis title". This will be where you enter an appropriate title with unit for the graph (hint - this should reflect what is already on your table).