Published On Jan 26, 2019
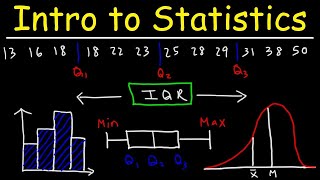
This statistics tutorial explains how to calculate the mean of grouped data. It also explains how to identify the interval that contains the median and mode of a grouped frequency distribution table.
Introduction to Statistics: • Introduction to Statistics
Mean, Median, Mode, & Range:
• Mean, Median, Mode, and Range - How T...
Weighted Mean & Averages:
• How To Find The Weighted Mean and Wei...
Find Missing Value Given The Mean:
• How To Find The Missing Value Given T...
_______________________________________
Arithmetic, Geometric, & Harmonic Mean:
• Arithmetic Mean, Geometric Mean, Weig...
Simple Frequency Tables:
• How To Make a Simple Frequency Table
Stem and Leaf Plots:
• Stem and Leaf Plots
________________________________________
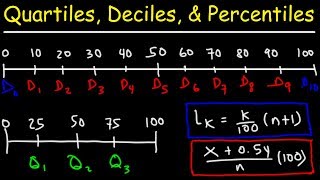
Quartiles, Deciles, & Percentiles:
• Quartiles, Deciles, & Percentiles Wit...
Interquartile Range & Outliers:
• How To Find The Interquartile Range &...
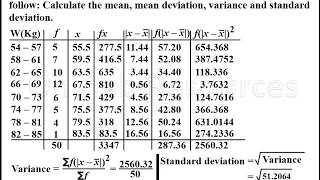
Standard Deviation of Grouped Data:
• How To Calculate The Standard Deviati...
________________________________________
Introduction to Probability:
• Introduction to Probability, Basic Ov...
Probability Formulas:
• Probability Formulas, Symbols & Notat...
Probability Tree Diagrams:
• Probability Tree Diagrams
Probability - Normal Distributions:
• Standard Normal Distribution Tables, ...
Final Exams and Video Playlists:
https://www.video-tutor.net/