AGRON Info-Tech
6.06K subscribers
5:51
Publication ready style mean comparison test table in R | LSD test table
AGRON Info-Tech
285 views • 6 days ago
6:00
Quickly generate multiple bar charts along with SE and lettering in R
AGRON Info-Tech
230 views • 11 days ago
6:37
Creating hexagon plot using R program
AGRON Info-Tech
293 views • 1 month ago
5:49
Time Series Forecasting for Nile River's Annual Streamflow Data
AGRON Info-Tech
360 views • 1 month ago
6:08
Understanding date and time objects in R
AGRON Info-Tech
94 views • 2 months ago
11:16
How to Choose the Perfect ARIMA Function Order for Time Series Analysis in R
AGRON Info-Tech
162 views • 7 months ago
7:42
Time Series Forecasting Explained: Analyzing Air Passenger Data
AGRON Info-Tech
786 views • 8 months ago
4:26
Creating rapid summary table showing mean and standard error using R program
AGRON Info-Tech
1.1K views • 8 months ago
5:17
Elegant bar plot using R program: Ideal for Research Article Publications
AGRON Info-Tech
377 views • 9 months ago
5:49
How to perform Structural Equation Modeling (SEM) in R
AGRON Info-Tech
9.6K views • 11 months ago
16:52
DataFocus a newly search based analytics tool
AGRON Info-Tech
183 views • 1 year ago
9:05
Publication ready ANOVA table in R
AGRON Info-Tech
11K views • 2 years ago
11:03
Path analysis in R | SEM | Lavaan
AGRON Info-Tech
18K views • 2 years ago
11:52
Plotting correlation matrix | Corrplot() function | Rstudio
AGRON Info-Tech
1.7K views • 3 years ago
10:40
Visualizing scatterplots in R | Correlation | ggscatter(), pairs(), ggpairs()
AGRON Info-Tech
10K views • 3 years ago
7:08
Correlation analysis in R
AGRON Info-Tech
3.8K views • 3 years ago
13:27
Plotting bargraph with SE and alphabets in R | LSD test
AGRON Info-Tech
12K views • 3 years ago
17:35
Biplot for PCs using base graphic functions in R
AGRON Info-Tech
12K views • 3 years ago
9:25
Biplot for principal component analysis in r
AGRON Info-Tech
43K views • 4 years ago
12:55
Principal component analysis in R
AGRON Info-Tech
31K views • 4 years ago
7:14
Paired sample t Test in R
AGRON Info-Tech
2.4K views • 4 years ago
7:55
Two sample t-Test in R
AGRON Info-Tech
3.3K views • 4 years ago
5:07
One sample t-Test in R
AGRON Info-Tech
2.2K views • 4 years ago
7:40
Random Latin Hypercube Sampling in R
AGRON Info-Tech
4.8K views • 4 years ago
8:09
Visualizing clusters in R | Hierarchical clustering
AGRON Info-Tech
28K views • 4 years ago
8:19
Plotting bar graphs with standard error bars in R
AGRON Info-Tech
11K views • 4 years ago
7:54
Two way repeated measures analysis in R
AGRON Info-Tech
19K views • 4 years ago
5:40
One way repeated measures ANOVA in R
AGRON Info-Tech
14K views • 4 years ago
5:13
Cluster analysis in R - K means clustering | part 2
AGRON Info-Tech
3.4K views • 4 years ago
2:45
Preparing data file for cluster analysis in R
AGRON Info-Tech
5.4K views • 4 years ago
Load More

 5:51
5:51 6:00
6:00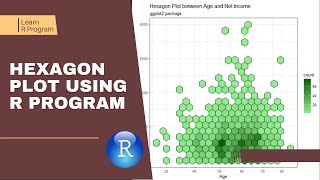 6:37
6:37 5:49
5:49 6:08
6:08 11:16
11:16 7:42
7:42 4:26
4:26 5:17
5:17 5:49
5:49 16:52
16:52 9:05
9:05 11:03
11:03 11:52
11:52 10:40
10:40 7:08
7:08 13:27
13:27 17:35
17:35 9:25
9:25 12:55
12:55 7:14
7:14 7:55
7:55 5:07
5:07 7:40
7:40 8:09
8:09 8:19
8:19 7:54
7:54 5:40
5:40 5:13
5:13 2:45
2:45