storytelling with data
42K subscribers
4:43
Make waffle charts! (Excel & PowerPoint)
storytelling with data
1K views • 2 weeks ago
6:08
How a data storyteller transforms a FUNNEL CHART
storytelling with data
1.9K views • 3 weeks ago
7:47
Uncover the insights from this busy bar chart!
storytelling with data
2.5K views • 1 month ago
6:15
Make bullet charts in Excel (three versions!)
storytelling with data
2.5K views • 2 months ago
6:34
Sketch your data: bring a table to life
storytelling with data
3.2K views • 4 months ago
4:44
Corporate slide decks don't have to be restrictive
storytelling with data
2.3K views • 6 months ago
8:06
Make waterfall charts in Excel (the EASY way!)
storytelling with data
28K views • 6 months ago
22:46
#1 tip for better presentations
storytelling with data
4.2K views • 6 months ago
6:22
3 easy tips for annotating graphs
storytelling with data
7.1K views • 8 months ago
7:03
Data storyteller improves PIE CHARTS | EP.4 Where are your eyes drawn?
storytelling with data
4.5K views • 9 months ago
4:26
Level up your data viz skills with the SWD community
storytelling with data
1.9K views • 10 months ago
3:43
When to use a table vs. a graph
storytelling with data
4.6K views • 11 months ago
7:27
You don't have time to make a beautiful slide
storytelling with data
4K views • 11 months ago
8:27
How to create a PPT presentation
storytelling with data
4.9K views • 1 year ago
1:41
What you'll learn in an SWD masterclass
storytelling with data
1.8K views • 1 year ago
6:53
Design emails your coworkers will appreciate
storytelling with data
3K views • 1 year ago
5:56
Save time & repetition with chart templates
storytelling with data
3.7K views • 1 year ago
8:30
A Harry Potter approach to better graphs
storytelling with data
3.5K views • 1 year ago
9:10
Avoid these 5 slide mistakes
storytelling with data
9.4K views • 1 year ago
11:06
Transform a busy graph into a simple communication | data viz example
storytelling with data
4.9K views • 1 year ago
8:29
Data storyteller improves a DASHBOARD | EP.3 Where are your eyes drawn?
storytelling with data
4.6K views • 1 year ago
8:55
Quick tips for better virtual presentation slides & delivery
storytelling with data
4.2K views • 1 year ago
11:39
Use sticky notes to improve your next presentation
storytelling with data
4.5K views • 1 year ago
13:23
Make it in Excel! | Diverging bar charts
storytelling with data
9.7K views • 1 year ago
6:14
Must-have tools for remote meetings & presentations
storytelling with data
2.5K views • 1 year ago
18:49
Learn by example: effective virtual presentation
storytelling with data
2.7K views • 1 year ago
8:48
Transform dashboard insights into an action-inspiring story
storytelling with data
13K views • 1 year ago
6:58
Line graphs & slopecharts: what you should know
storytelling with data
3.5K views • 1 year ago
5:51
How to focus attention in data visualization
storytelling with data
4.3K views • 1 year ago
7:19
Stop making wordy slides!
storytelling with data
3.1K views • 1 year ago
Load More

 4:43
4:43 6:08
6:08 7:47
7:47 6:15
6:15 6:34
6:34 4:44
4:44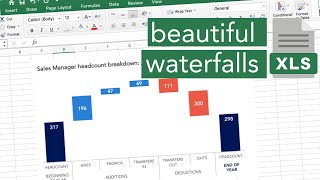 8:06
8:06 22:46
22:46 6:22
6:22 7:03
7:03 4:26
4:26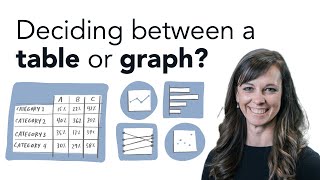 3:43
3:43 7:27
7:27 8:27
8:27 1:41
1:41 6:53
6:53 5:56
5:56 8:30
8:30 9:10
9:10 11:06
11:06 8:29
8:29 8:55
8:55 11:39
11:39 13:23
13:23 6:14
6:14 18:49
18:49 8:48
8:48 6:58
6:58 5:51
5:51 7:19
7:19