Published On Jan 22, 2021
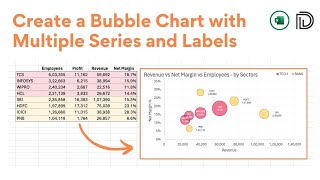
In this video, you will learn how to create a bubble chart with three variables in Microsoft Excel. A bubble chart is a variation of a scatter chart in which the data points are replaced with bubbles, and an additional dimension of the data is represented in the size of the bubbles. A bubble chart is a type of chart that displays three dimensions (three variables) of data. You can easily Create a Bubble Chart with 3 Variables in Excel. You can easily conditionally format bubble chart (edit axis label or values, change the color and size of bubble and chart title ) by following simple instructions which are given in this video. I have used Microsoft Excel 2016 to Create a Bubble Chart with 3 Variables in Excel. You can use other versions of excel such as excel 2010, excel 2013, excel 365 and excel 2019 to Create a Bubble Chart with 3 Variables in Excel.
#bubblechart #scatterplot #excel #threevariable #teachingjunction
Watch other YouTube video tutorials on Excel:
How to Create a Bubble Chart with Multiple Data Series: • How to Create a Bubble Chart with Mul...
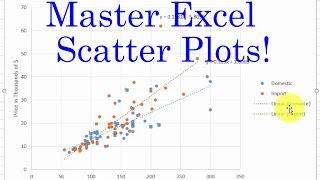
Creating an XY Scatter Plot in Excel: • Creating an XY Scatter Plot in Excel ...
Scatter Plot for Multiple Data Sets in Excel: • Scatter Plot for Multiple Data Sets i...
How to change vertical Axis Values in Excel (Line chart): • How to Change the Vertical Axis (y-ax...
Other YouTube queries:
Create a Bubble Chart with Multiple Series of Data,
Create a Bubble Chart,
Bubble Chart with 3 Variables in Excel,
How To Create A Bubble Plot In Excel (With Labels!),
How to Make a Bubble Chart in Excel 2016,
How to Create a Bubble Chart in Excel,