Published On Dec 11, 2023
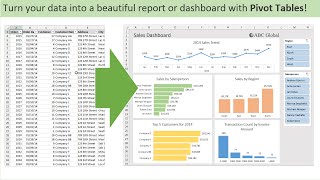
Quickly analyze large amounts of data with a Pivot Table! Welcome to our comprehensive beginner's guide on how to create Microsoft Excel Pivot Tables and Pivot Charts! Whether you're new to Excel or looking to enhance your skills, this tutorial is packed with essential tips and tricks to master these powerful tools.
Practice Data: https://go.teachers.tech/PivotTable
0:00 Introduction: Kickstart your journey to Excel proficiency.
0:27 Inserting a Pivot Table: Step-by-step guide on setting up your first pivot table.
3:00 Selecting Fields: How to choose the right fields for impactful data analysis.
5:26 Adjusting Rows and Columns: Customizing pivot tables for better data visualization.
6:26 Sorting in Pivot Tables: Techniques for efficient data organization.
7:50 Filtering Pivot Tables: Learn to focus on the data that matters most.
9:03 Creating Individual Worksheets: Organize data with separate worksheets for each item.
10:57 Pivot Table Tips and Tricks: Elevate your skills with advanced strategies.
13:12 Conditional Formatting: Make your data stand out with conditional formatting techniques.
14:33 Adding a Pivot Chart: Integrating visual elements for enhanced data interpretation.
16:29 Customizing Pivot Charts: Tailor your charts for maximum impact.
Join us as we delve into the essentials of creating and customizing pivot tables and charts in Microsoft Excel. You'll learn how to sort, filter, and format your data for more insightful analysis. Don't miss our exclusive tips and tricks to elevate your Excel skills. Perfect for beginners eager to become proficient in data analysis and visualization with Excel.