Published On Mar 5, 2024
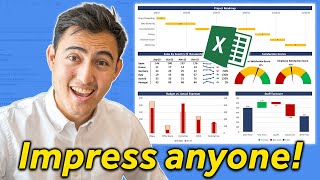
Learn how to use the power of waterfall charts, an insightful tool revealing running totals by tracking additions and subtractions. Uncover the dynamics of your Income Statements year over year, effortlessly visualizing the components influencing your net income. Easily interpret the transformations from one year to the next. Elevate your financial understanding with our user-friendly guide to optimizing and interpreting waterfall charts for strategic insights. This tutorial will guide you step by step and make financial analysis a breeze! Learn how to archive your charts and link back to original data. #waterfallchart #incomestatement
Don't forget to subscribe to our channel for more handy Excel tutorials!
Free content to those who Subscribe: https://professoroffice.com/contact
00:00 Overview of Income Statements Used for Analysis
00:40 Extrapolate and Overview the Data for the Chart
02:17 Create the Waterfall Chart and review of necessary changes.
04:15 Make necessary adjustments
05:29 Review of changes and make Analysis
07:27 Create picture for archival data.
09:32 Place picture into Notes with Link back to original data.
11:30 Free content for Subscribers