Published On May 7, 2021
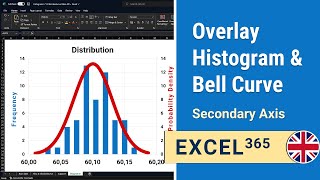
Excel Histogram with Normal Distribution Curve
In this video, we will explain how you can create a histogram with a normal distribution curve in Excel.
0:00 Excel Histogram with Normal Distribution Curve Intro
0:44 Creating Histogram Table using Analysis Toolpak
2:31 Inserting the Histogram
4:22 Inserting the Normal Distribution Curve
Download Excel File:
Before we can ask Excel to insert the table, we first need to define the bins. Here we choose to start at 150 and then jump by 5 up to 200. Now we navigate to Data and select Data Analysis. A menu opens where we select Histogram, we press on OK and the Histogram menu opens.
Now we are ready to start creating the histogram and normal distribution curve. First, we select the histogram data, navigate to Insert, and select Scatter with Smooth Lines and Markers. The graph appears on the screen.
Next, we adjust the x-axis such that the curve is bigger and more centered on the screen. We double-click on the x-axis such that the Format Axis panel opens. Here, you go to the three bars icon, click on Axis Options and change the minimum and maximum to whatever suits you.
In the next step, we click on Add Chart Element, Error Bars, and More Error Bars Options. The Format Error Bars panel opens and you click on the three bars icon. Here, you select Minus, No Cap, Percentage, and set Percentage to 100.
We only need to remove the curve from the chart before we start with creating the normal distribution curve. To remove the curve, we click on it. This opens the Format Data Series panel. Here, we can select No line in the Line section. Under Marker, we navigate to Marker Options and select None.
Let’s start adding the normal distribution curve. To construct the curve, we first must define the data points. We will compute the corresponding y-values to the x-values between 145 and 205 as this covers the entire x-range of the histogram.
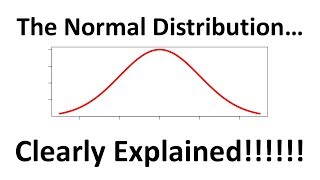
To compute the corresponding y-values, we first use the NORM.DIST function to compute the normal probability distribution curve. So, we type equals NORM.DIST of the x-value, mean, standard deviation and finally we insert FALSE to indicate we want the probability and not the cumulative distribution function.
Now we are ready to add the normal distribution curve to the chart. This can be done by selecting the graph, then Chart Design, and pressing on Select Data. We click on Add, insert the x-values and y-values and press on OK.
To change this, we insert a new column and add the midpoints of the bins instead of the endpoints. Next, we click on the histogram and drag the purple square representing the x-values to the midpoints. The graph is now how we want.
This concludes our tutorial on Excel Histogram with normal distribution curve. I'm inspired by content creators as Leila Gharani and Teacher's Tech.
#Excel #Tutorials #Statistics