Published On Oct 29, 2023
A Raincloud Plot is a data visualization tool that provides a comprehensive view of a dataset by combining several plots into one figure. It essentially brings together the power of a box plot, violin plot, and a strip or swarm plot, making it easier to understand both the overall distribution and the raw data of a given variable or group.
But what are the components of a Raincloud Plot?
Cloud (Violin Plot):
The "cloud" in the Raincloud Plot is a rotated and horizontally aligned kernel density estimation (similar to a violin plot) that shows the distribution density of the data. It provides insights into the shape of the data distribution, highlighting areas of higher density.
Rain (Strip or Swarm Plot):
The "rain" consists of individual data points or raw data, represented as dots. This part of the plot shows each data point, giving a clear view of the raw data.
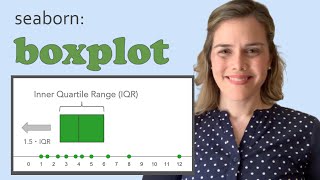
Boxplot:
Often there's a traditional box plot, showing the median and interquartile range.
► Make a Raincloud Plot online
https://datatab.net/statistics-calcul...
► E-BOOK
https://datatab.net/statistics-book