Published On Mar 5, 2024
Descriptive statistics is a branch of statistics that involves summarizing and organizing data in a way that it can be easily understood. This statistical method focuses on describing and understanding the features of a specific data set by providing summaries about the sample and measures of the data. The main goal is to present a large amount of data in a clear and concise manner for easy interpretation, without making any conclusions beyond the data itself or inferring any patterns that may apply to a larger population.
► Statistics Calculator
https://datatab.net/statistics-calcul...
► EBOOK
https://datatab.net/statistics-book
► Tutorial
https://datatab.net/tutorial/descript...
--- Videos --
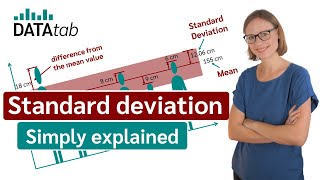
► Standard Deviation and Variance
• Standard Deviation and Variance
► Box-Plot
• Box-Plot (Simply explained and create...
► Violin Plot
• Violin Plot [Simply explained]
► Raincloud Plot
• What is a Raincloud Plot? [Simply exp...
0:00 What is Descriptive Statistics?
1:05 What are Measures of Central Tendency?
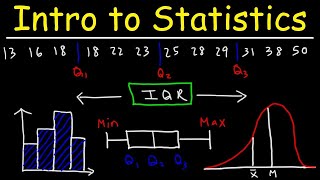
2:51 What are Measures of Dispersion?
6:06 What are Frequency table and Contingency table?
8:07 Charts in Descriptive Statistics