Published On Oct 5, 2023
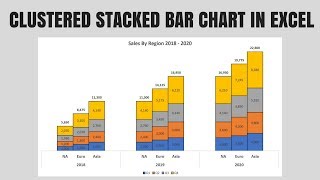
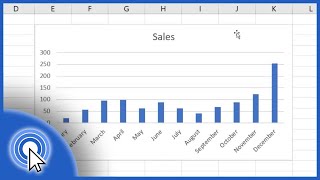
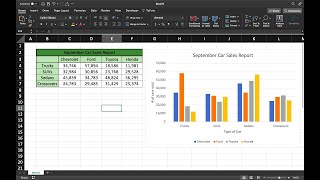
Do you want to create a chart with two different categories of data? For example: sales by Type of Product AND by Quarter? This video shows you how to do this with a simple bar chart in Microsoft Excel.
I hope you find it helpful!
Chapters:
0:00 Intro
0:47 Prepare the data
5:10 Create the bar chart
5:58 Format the chart for usability
12:50 Summary
*************************************
Video is made by Filmora: https://filmora.wondershare.com/
Website: https://www.DataDesignStyle.com
show more