Published On Aug 18, 2017
To learn Lean Six Sigma Most Effectively and Practically visit https://www.successfulcareerhub.com/p...
Hello Friends,
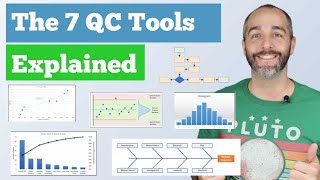
This video is about the Scatter Diagram (Scatter Plot), one of the most important quality control tools. I have explained these tools with the help of practical examples which will be very easy to understand.
The video consists of the following points:
✅Introduction
✅Scatter Diagram (Scatter Plot)
✅When to use Scatter Diagram (Scatter Plot)
✅Scatter Diagram Example
✅Scatter Diagram Considerations
✅Scatter Diagram In Excel
✅Scatter Diagram In Minitab
✅Matrix Scatter Plot (Scatter Plot)
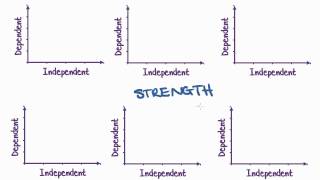
✅How to read Scatter Plot?
✅Degree of Correlation
✅Types of Correlation
I am sure, you will like it.
Some important links about LEARN & APPLY:
🏫 Know about LEARN & APPLY: https://www.learnandapply.org/
👨🏽🏫 Know about Myself (Trainer/Coach): https://vijaysabale.com/
🎥 Step 1- Register for my next LIVE Masterclass: https://vijaysabale.co/webinar
👨👩👦👦 Step 2- Join my community: https://vijaysabale.co/Join
You can also visit our Learning Management System (LMS) 📚📖📑 to access online courses at:
https://www.successfulcareerhub.com/p...
Join this channel to get access to the perks:
/ @learnandapply
0:00 Introduction of Scatter Diagram (Scatter Plot)
0:49 Scatter Diagram (Scatter Plot)
1:13 When to use Scatter Diagram (Scatter Plot)
1:58 Scatter Diagram Example
2:26 Scatter Diagram Considerations
3:35 Scatter Diagram In Excel
4:19 Scatter Diagram In Minitab
4:52 Matrix Scatter Plot
5:38 How to read Scatter Plot?
6:05 Types of Correlation
And finally, thank you for watching…
#scatterdiagram #scatterplot #correlation #graphicaltools #scatterplotexcel #sixsigma #learnandapply #successfulcareerhub #sixsigmaonline #minitab #leansixsigma