Published On Sep 21, 2022
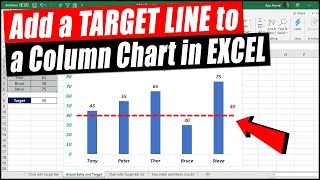
Adding a horizontal line or target line or average line or base line or benchmark line is one of the most effective way to compare and analyze actual data vs a target or a budget.
In this Excel video tutorial we are learning how to add a dynamic target line that can change its positive in Excel chart if the target changes or data updates.
Adding a horizontal line to Excel charts is not difficult if you know how to do it as the option is not available by default in Excel. Therefore some clever workaround is required to get it done. Lets see how its done!
Lets Excel!
For more Excel tips, tricks and tutorials don't forget to subscribe to @LearnExceltoexcel YT channel.
Learn #Excel your way:
===================
Website: https://learnexceltoexcel.com/
--------------------------------------
Pick your favourite social page:
Fb: https://bit.ly/3yM3dvd
Tiktok: https://bit.ly/3wFllpf
Tw: https://bit.ly/3wGCRYU
Pin: https://bit.ly/3NsjKIU
Yt: https://bit.ly/3wxKL8a
Insta: https://bit.ly/3wtT9oW
Music by: / ikson
#excelcharts #targetlinechart #exceltutorial #exceltips