Published On Oct 28, 2022
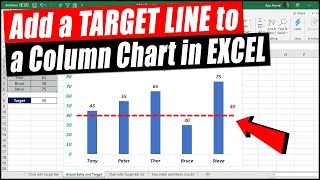
In this Excel video tutorial we are learning how to make actual vs target chart in Excel. This target chart is super easy to make in excel in seconds.
Actual vs targets chart or actual vs planned charts basically compare budget figures with actual performance and variance is determined that helps us decide control actions.
With target charts in Excel, it is much easier to understand the data and how actual results deviated from planned amounts. This is why actual vs target visual graphs are important and are made on daily basis.
In this tutorial we will also learn Excel shortcuts to insert chart and how to change chart type once inserted in Excel worksheet. So lets start a step by step Excel charting tutorial!
Lets Excel!
Download Practice Workbook for this tutorial:
https://1drv.ms/x/s!Apno7889bCyLqzCjx...
For more Excel tips, tricks and tutorials don't forget to subscribe to @LearnExceltoexcel channel.
Learn #Excel your way:
===================
Website: https://learnexceltoexcel.com/
--------------------------------------
Pick your favourite social page:
Fb: https://bit.ly/3yM3dvd
Tiktok: https://bit.ly/3wFllpf
Tw: https://bit.ly/3wGCRYU
Pin: https://bit.ly/3NsjKIU
Yt: https://bit.ly/3wxKL8a
Insta: https://bit.ly/3wtT9oW
Music by: / ikson
#actualvstarget #variancecharts #actualvstargetcharts #exceltutorial #exceltips #excelcharts