Published On Nov 27, 2015
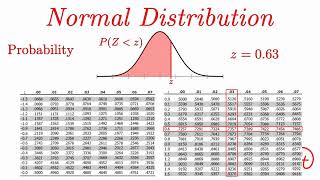
This video demonstrates how to create a graph of the standard normal distribution using Microsoft Excel. The standard normal distribution has a mean of zero and a standard deviation of one. The graph dynamically displays the area under the curve from the left of the distribution for a specified z-score.
show more