Published On Dec 16, 2022
In this lesson, I will show how to fill a selected area under the normal distribution curve in Microsoft Excel with a color.
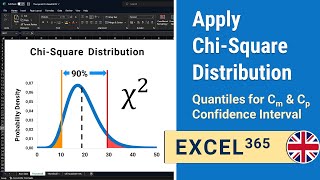
A typical question in the context of statistical process control is:
Between which two dimensions is a certain proportion of values to be expected?
Various distribution models are used for the calculation.
Sometimes, in addition to the two measures, you also want to emphasize the area under the distribution curve.
So two quantiles are needed. This example shows the 5% and 95% quantile (percentile). The 5% quantile is the left limit, and the 95% quantile is the right limit of the 90% range.
I wish you much success.
Rolf Ihde
show more