Published On Sep 28, 2022
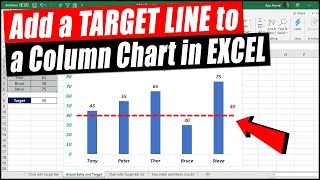
While working on Actual vs Target or Actual vs Budget data, its much easier if we can visualize it with the help of Excel charts. Especially if we can show the target ranges in the form of threshold or bands in the background of Excel Chart.
Threshold charts or horizontal band charts are extremely effective in visualizing the results. And one can analyze the situation with a single glance because we have a clear understanding of the target range or low, high and average range on the chart and where each KPI is falling on those threshold or bands.
In this Excel video tutorial, we are learning the simplest method to make threshold or banded charts in Excel in few simple steps.
Lets Excel!
Download Excel practice workbook from the following link:
https://1drv.ms/x/s!Apno7889bCyLqThlL...
For more Excel tips, tricks and tutorials don't forget to subscribe to @Learn Excel to excel YT channel.
Learn #Excel your way:
===================
Website: https://learnexceltoexcel.com/
--------------------------------------
Pick your favourite social page:
Fb: https://bit.ly/3yM3dvd
Tiktok: https://bit.ly/3wFllpf
Tw: https://bit.ly/3wGCRYU
Pin: https://bit.ly/3NsjKIU
Yt: https://bit.ly/3wxKL8a
Insta: https://bit.ly/3wtT9oW
Music by: / ikson
#excelcharts #thresholdcharts #exceltutorial #exceltips