Published On Jan 27, 2011
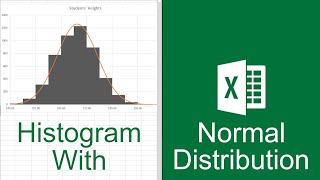
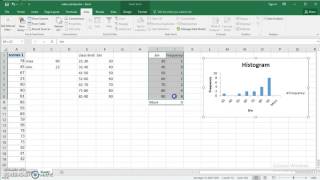
Learn how to plot a frequency distribution histogram in Microsoft Excel 2010. This helps you to see if your data are distributed normally.
Note - MAC keyboard commands differ from PC.
show more
Learn how to plot a frequency distribution histogram in Microsoft Excel 2010. This helps you to see if your data are distributed normally.
Note - MAC keyboard commands differ from PC.